
The Promotion Effect
A brief study on the underlying performance of teams promoted from the Championship to the Premier League.

An issue that arose when building a Premier League team strength model was how to assess promoted Championship teams in the early stages of their Premier League season.
One approach would be to ignore their prior Championship data and to only allow predictions for those teams once they have a reasonable number of Premiership games. I don’t like that strategy as it means that you will not have full predictions in the first few gameweeks of the season.
Another option is to apply a relative penalty to Championship data to normalize it against Premier League performance levels. Intuitively, you expect a big drop-off in performance level. Estimating the size of that drop-off is challenging, but an ELO system based on Premier League teams facing second-division sides could help create an index for this adjustment. I don’t like that approach either, most games in that context are in early-round cup games, where Premier League sides often rotate. This wouldn’t fully capture the quality gap.
My approach, and the purpose of this study, is to compare the underlying performance metrics of promoted teams during their Championship promotion campaign and their first season in the Premier League.
I will be looking at the expected goals for and against for each of these teams, and considering the total expected goals of the leagues in those seasons to put those numbers in context. I will then create a normalised average change in xG and xGA to create an estimate for this penalty value which I will then use in my modelling.
One downside to this approach is that we only have expected goals data dating back to 2017, with only 3 teams promoted a season, it means that we are working with a small sample size. I plan to refresh this study every season to build on the accuracy year on year.
The Championship Numbers
First, looking at the expected goals difference of all of the promoted sides in the Championship dating back to 2016/17, we have some teams that stand out clearly.
The average expected goal difference for these teams is +0.52, which seems low in the Pep Guardiola Man City era, where +1.00 is the norm. However, the Championship is far more competitive, as dominant teams leave each season, preventing any prolonged dominance.
Also, playoff-promoted teams are included in this sample. Since even 6th-place teams can get promoted, weaker teams often bring down the average.
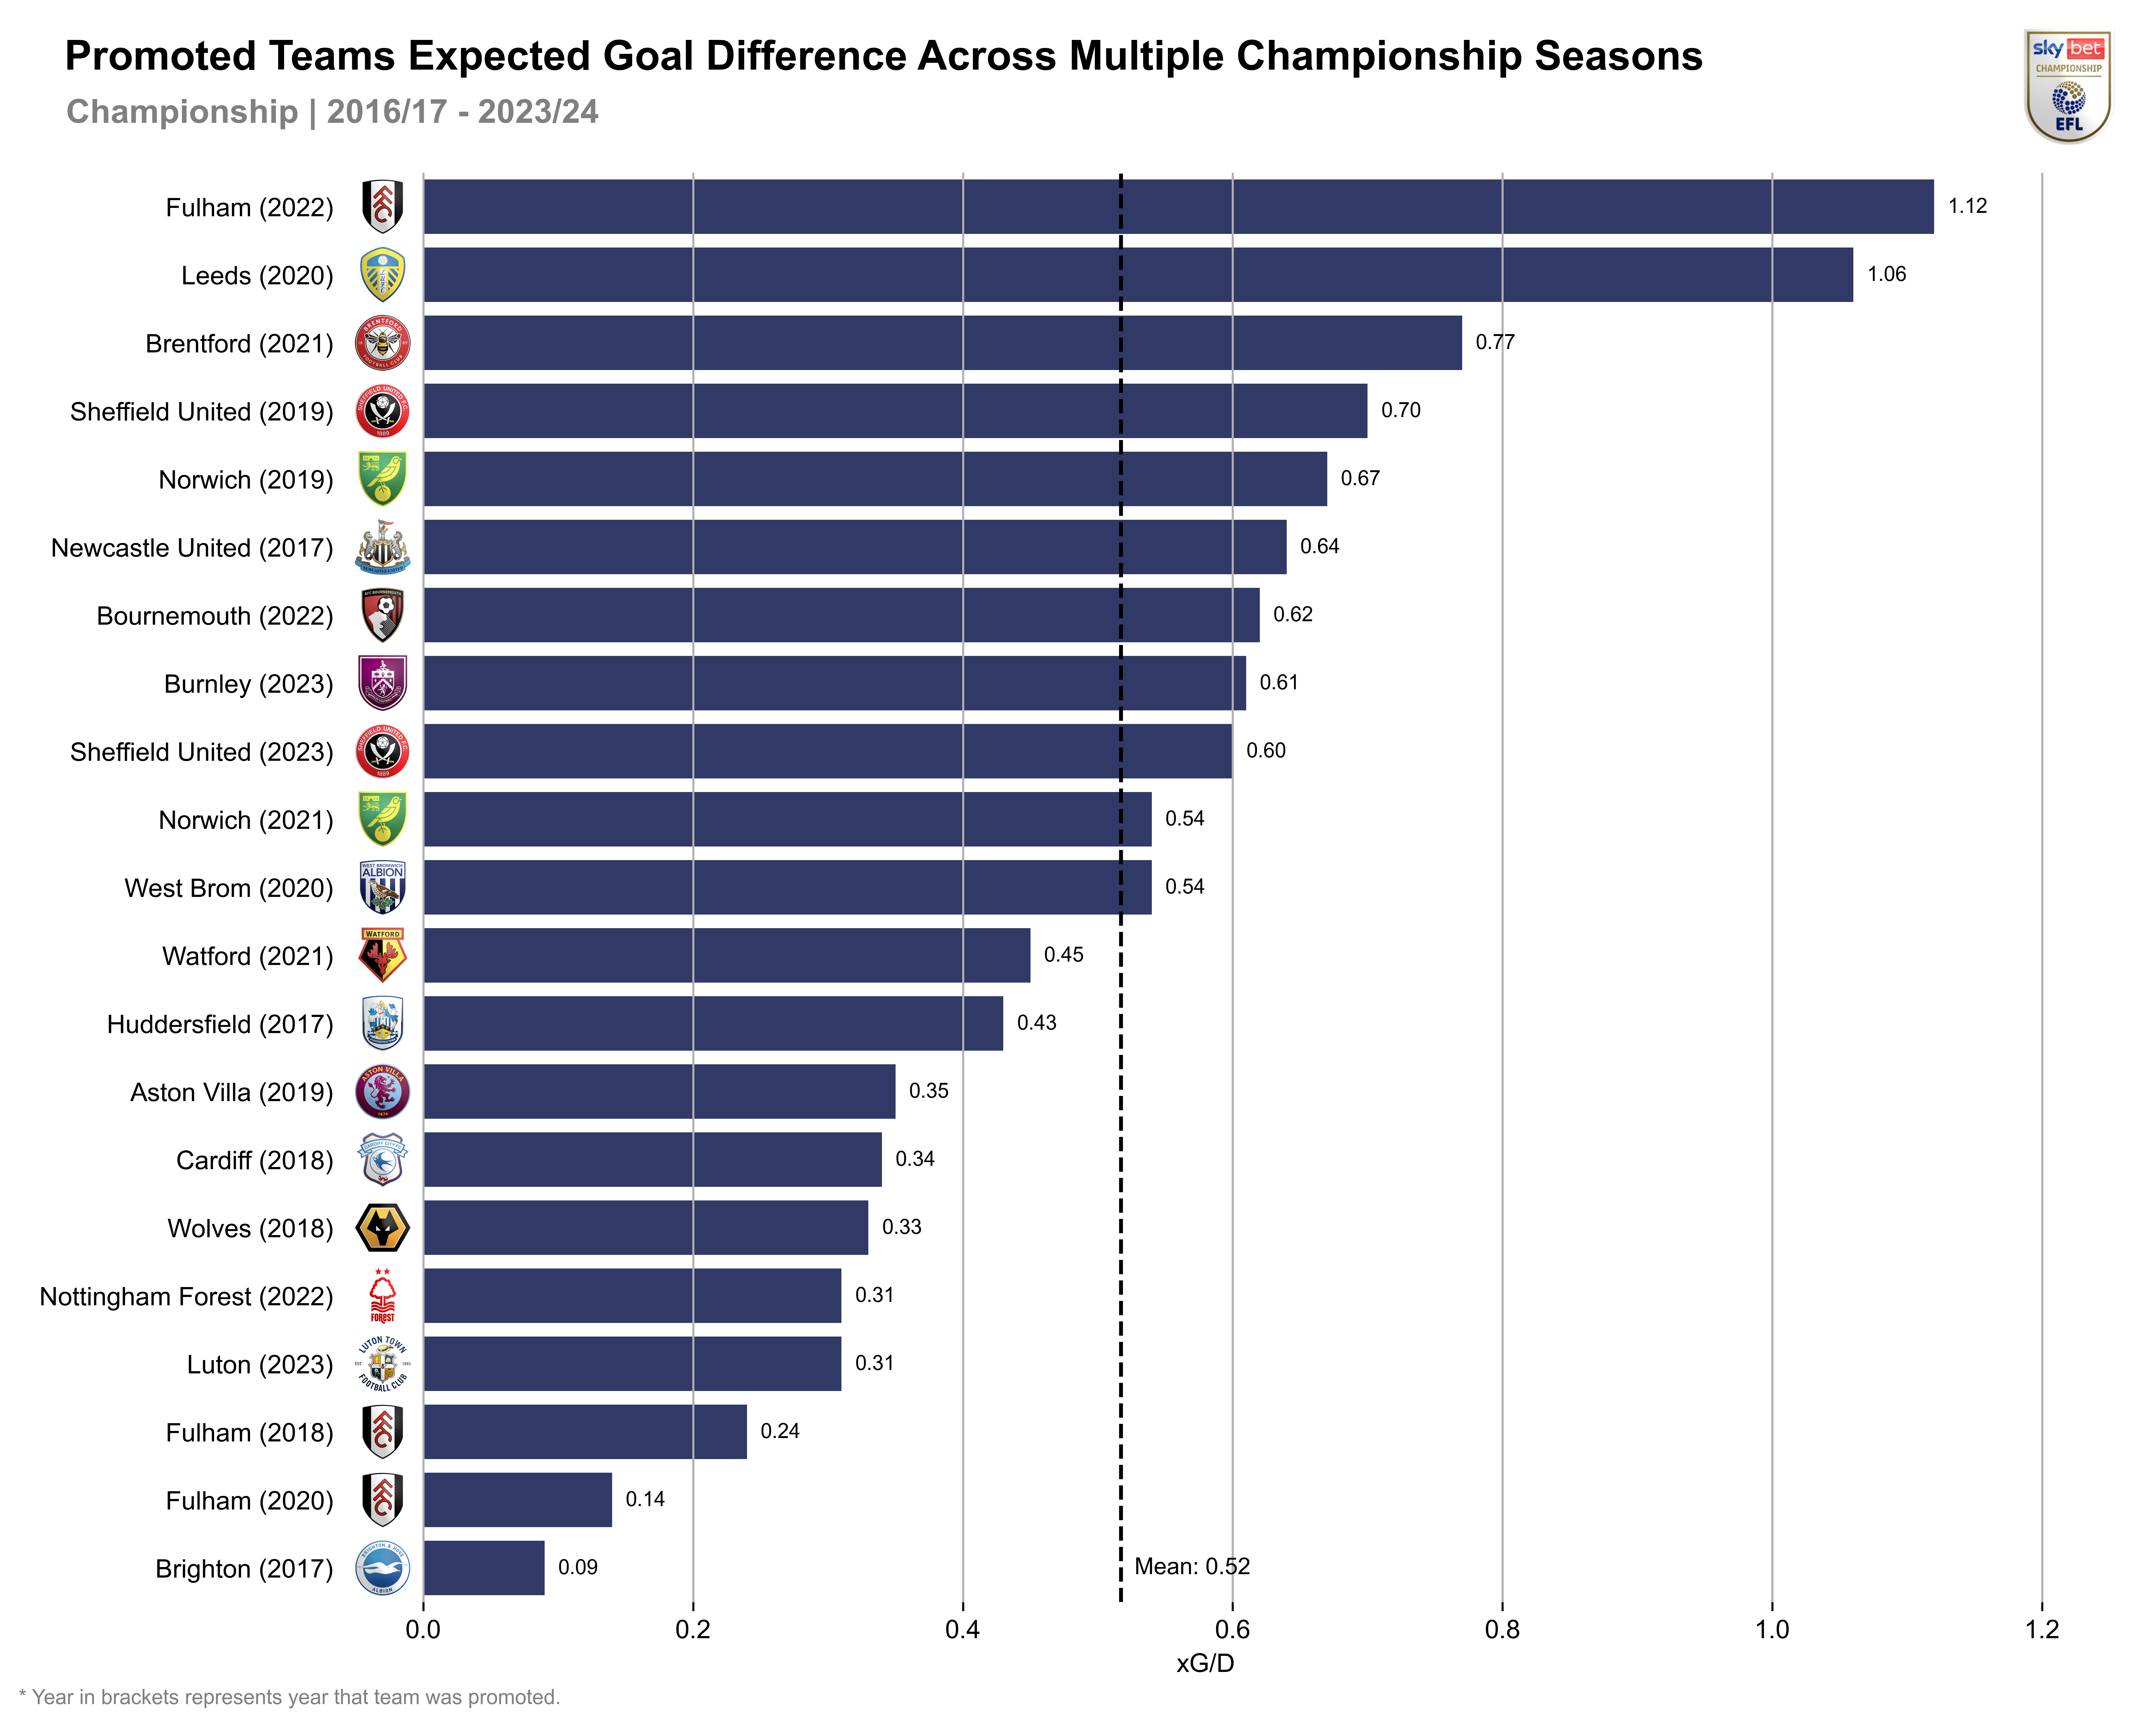
Marco Silva’s Fulham (promoted in 2022) and Bielsa’s Leeds (promoted in 2020) are the stand-out teams in terms of good performance, the only sides registering an expected goal difference of over +1.00 per game.
These sides are memorable to me for different reasons. The Leeds side was exciting, Bielsa at Leeds felt like a gift from the gods and their unique aggressive and direct style was a pleasure to watch. Fulham were led by the industrious Mitrovic who broke goal-scoring records with 43 goals! Both sides were dominant in a way that other promoted sides could not replicate.
Brighton, promoted in 2017 under Chris Hughton, stands out for different reasons. I was surprised to find their underlying numbers were so poor, as the club is now known for strong performance relative to their resources. It would be easy to assume they dominated the Championship, but Tony Bloom’s vision took time to materialize. Under Hughton, Brighton were pragmatic, and their early transfer business had many misses. Despite this, they earned 93 points and finished second, which is remarkable given their midtable expected goals difference.
The Premier League Numbers
Next, we'll examine how these teams performed in the Premier League. As expected, there’s a notable drop in performance, with an average expected goal difference per game of -0.53, over a goal less than during their promotion campaign.
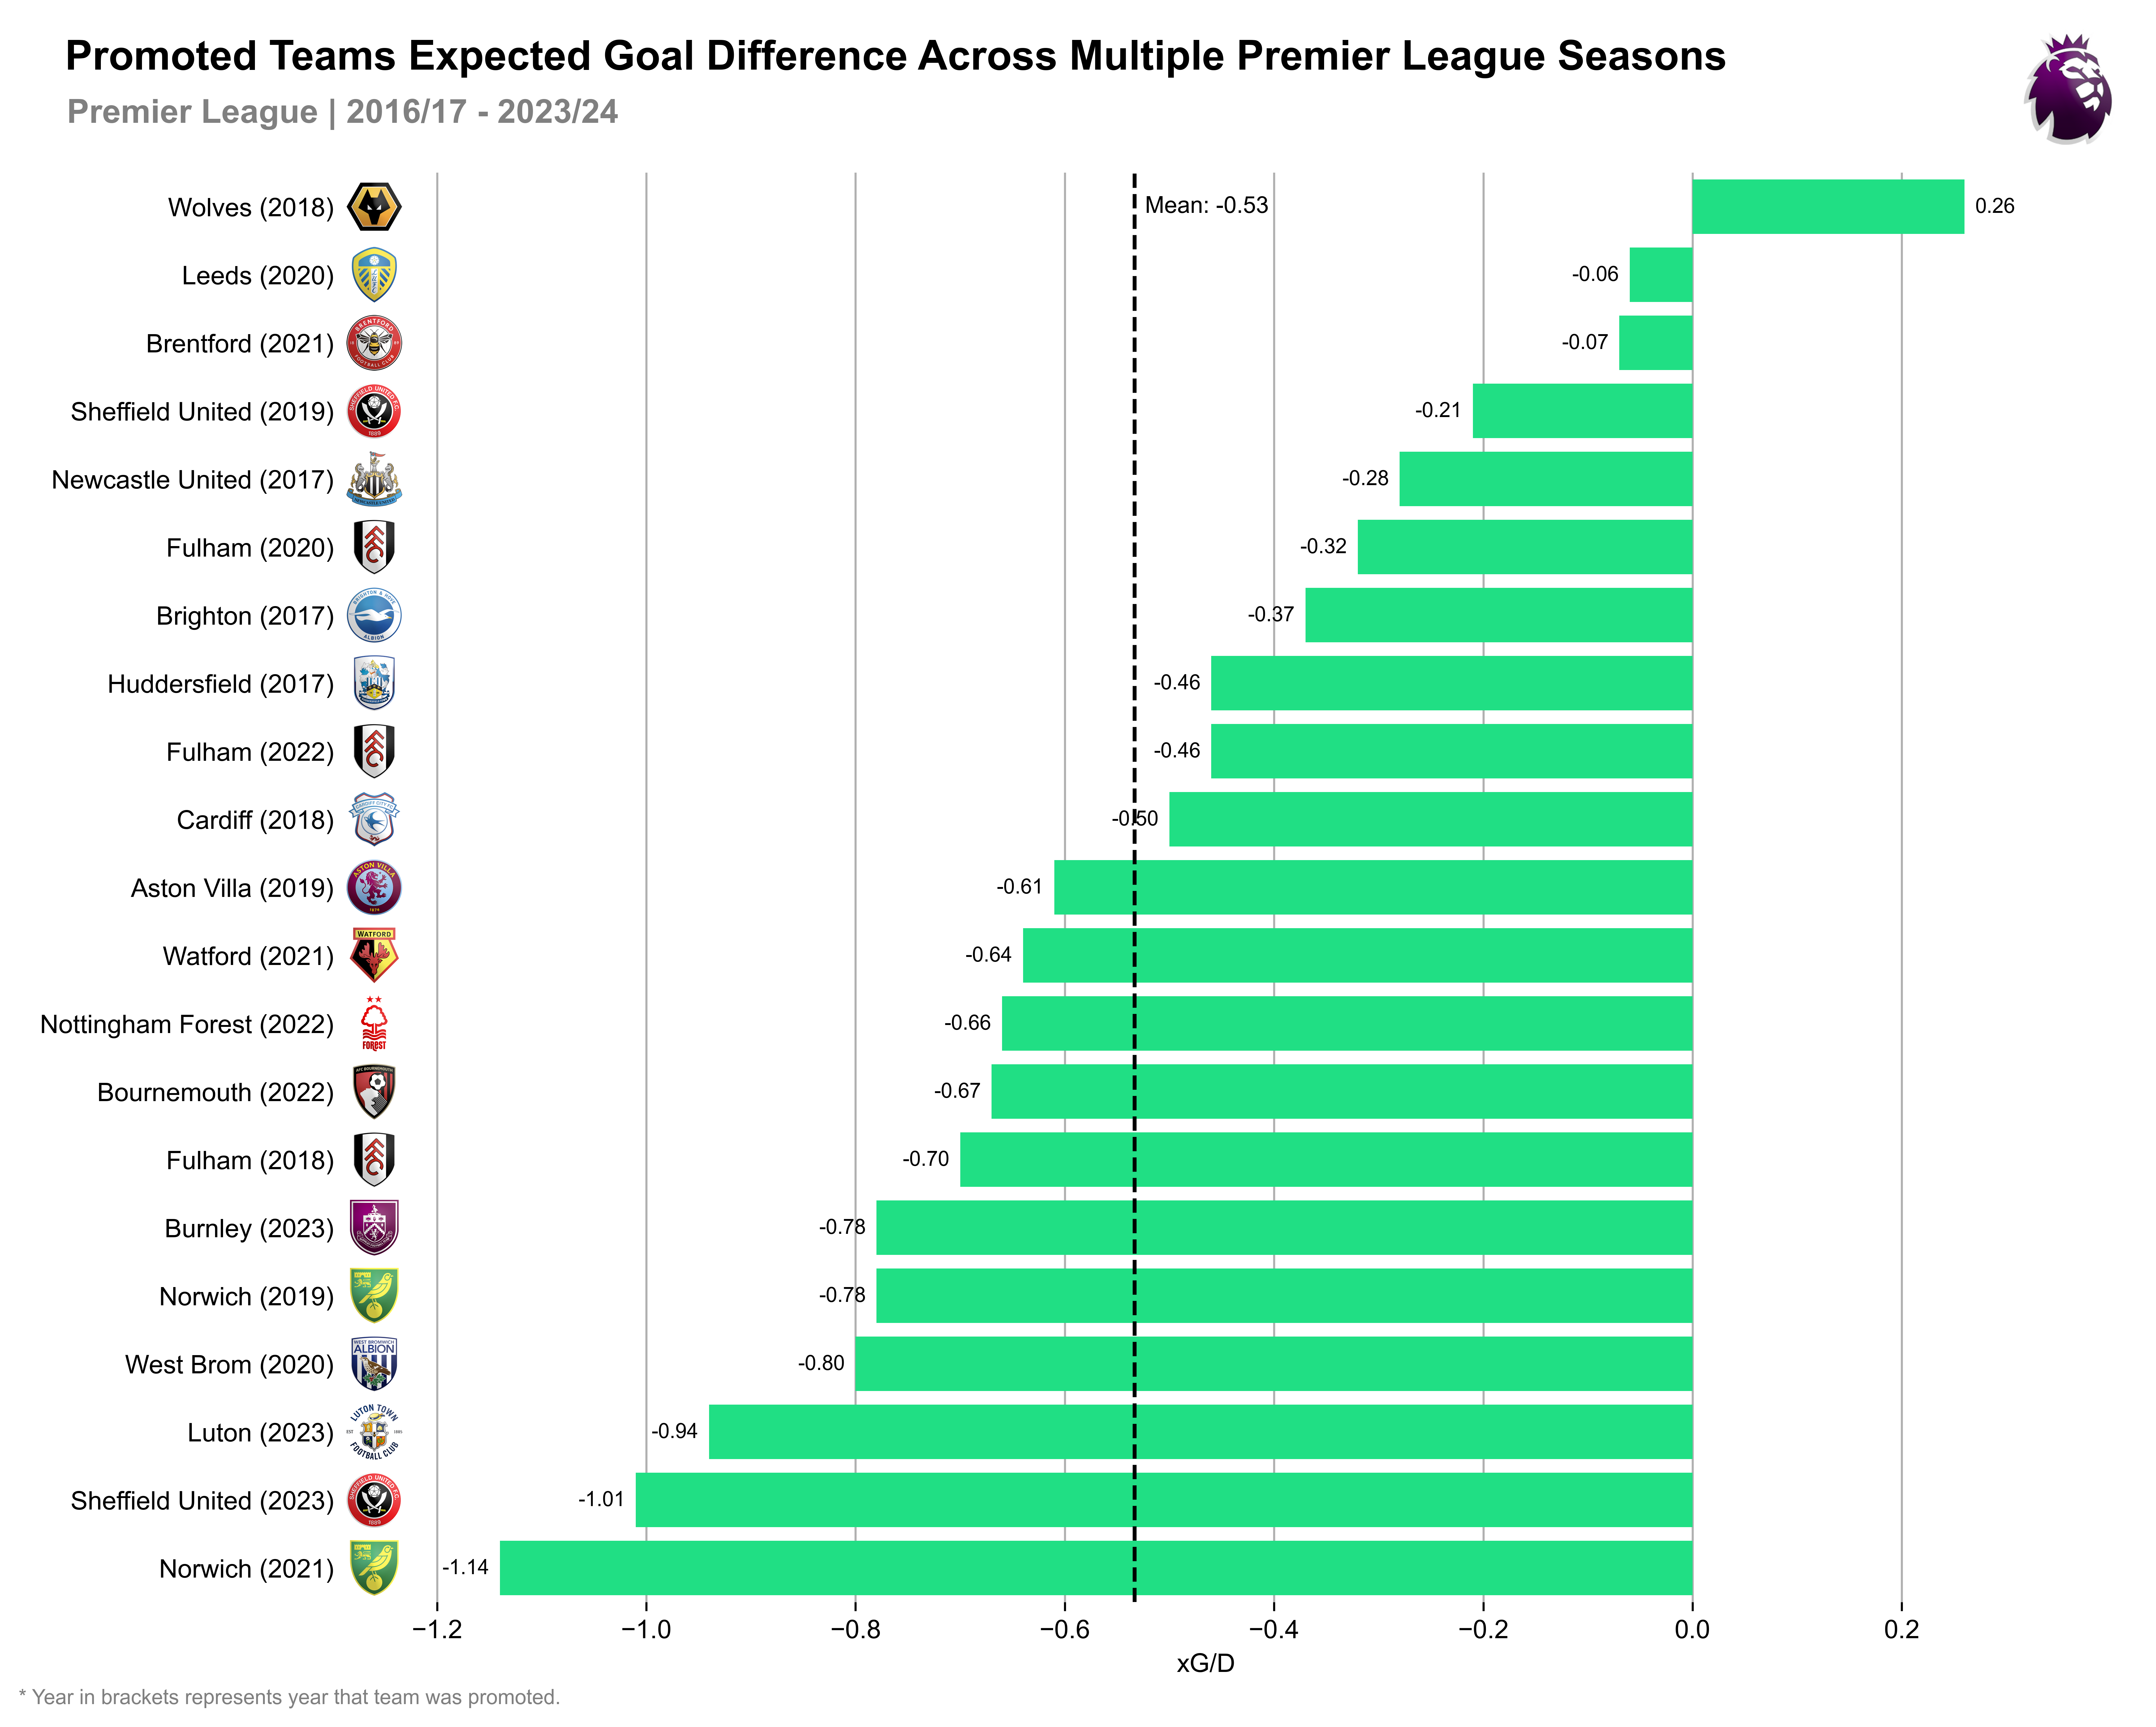
Wolves stand out among the other teams as the only ones to maintain a positive mean expected goal difference—impressive for a newly promoted side. While many teams secured top-half finishes in their first season, Wolves' 7th place in 2018 was well-deserved based on their underlying performances. What’s even more interesting is that their promotion season in the Championship was unremarkable, their xG/D towards the lower end of our sample. Wolves received a lot of investment in this period, which is likely a big contributor to this unique success.
Daniel Farke's 2020/21 Norwich team had the worst mean expected goal difference, closely followed by Sheffield United and Luton Town from last season. The numbers align with the eye test—they were truly awful.
Comparing the Change in Performances
We can now examine the changes in expected goals for and against between each team's Premier League and Championship seasons. The xG figures are normalised to the total league xG for each season to account for the 'xG climate' of those years.
The average normalized change in xG for promoted teams was -33.49%, meaning they generated 33.49% fewer expected goals per game in the Premier League compared to their Championship season. The average normalized change in xGA was 46.48%, indicating they conceded 46.48% more expected goals during their top-flight survival campaign.
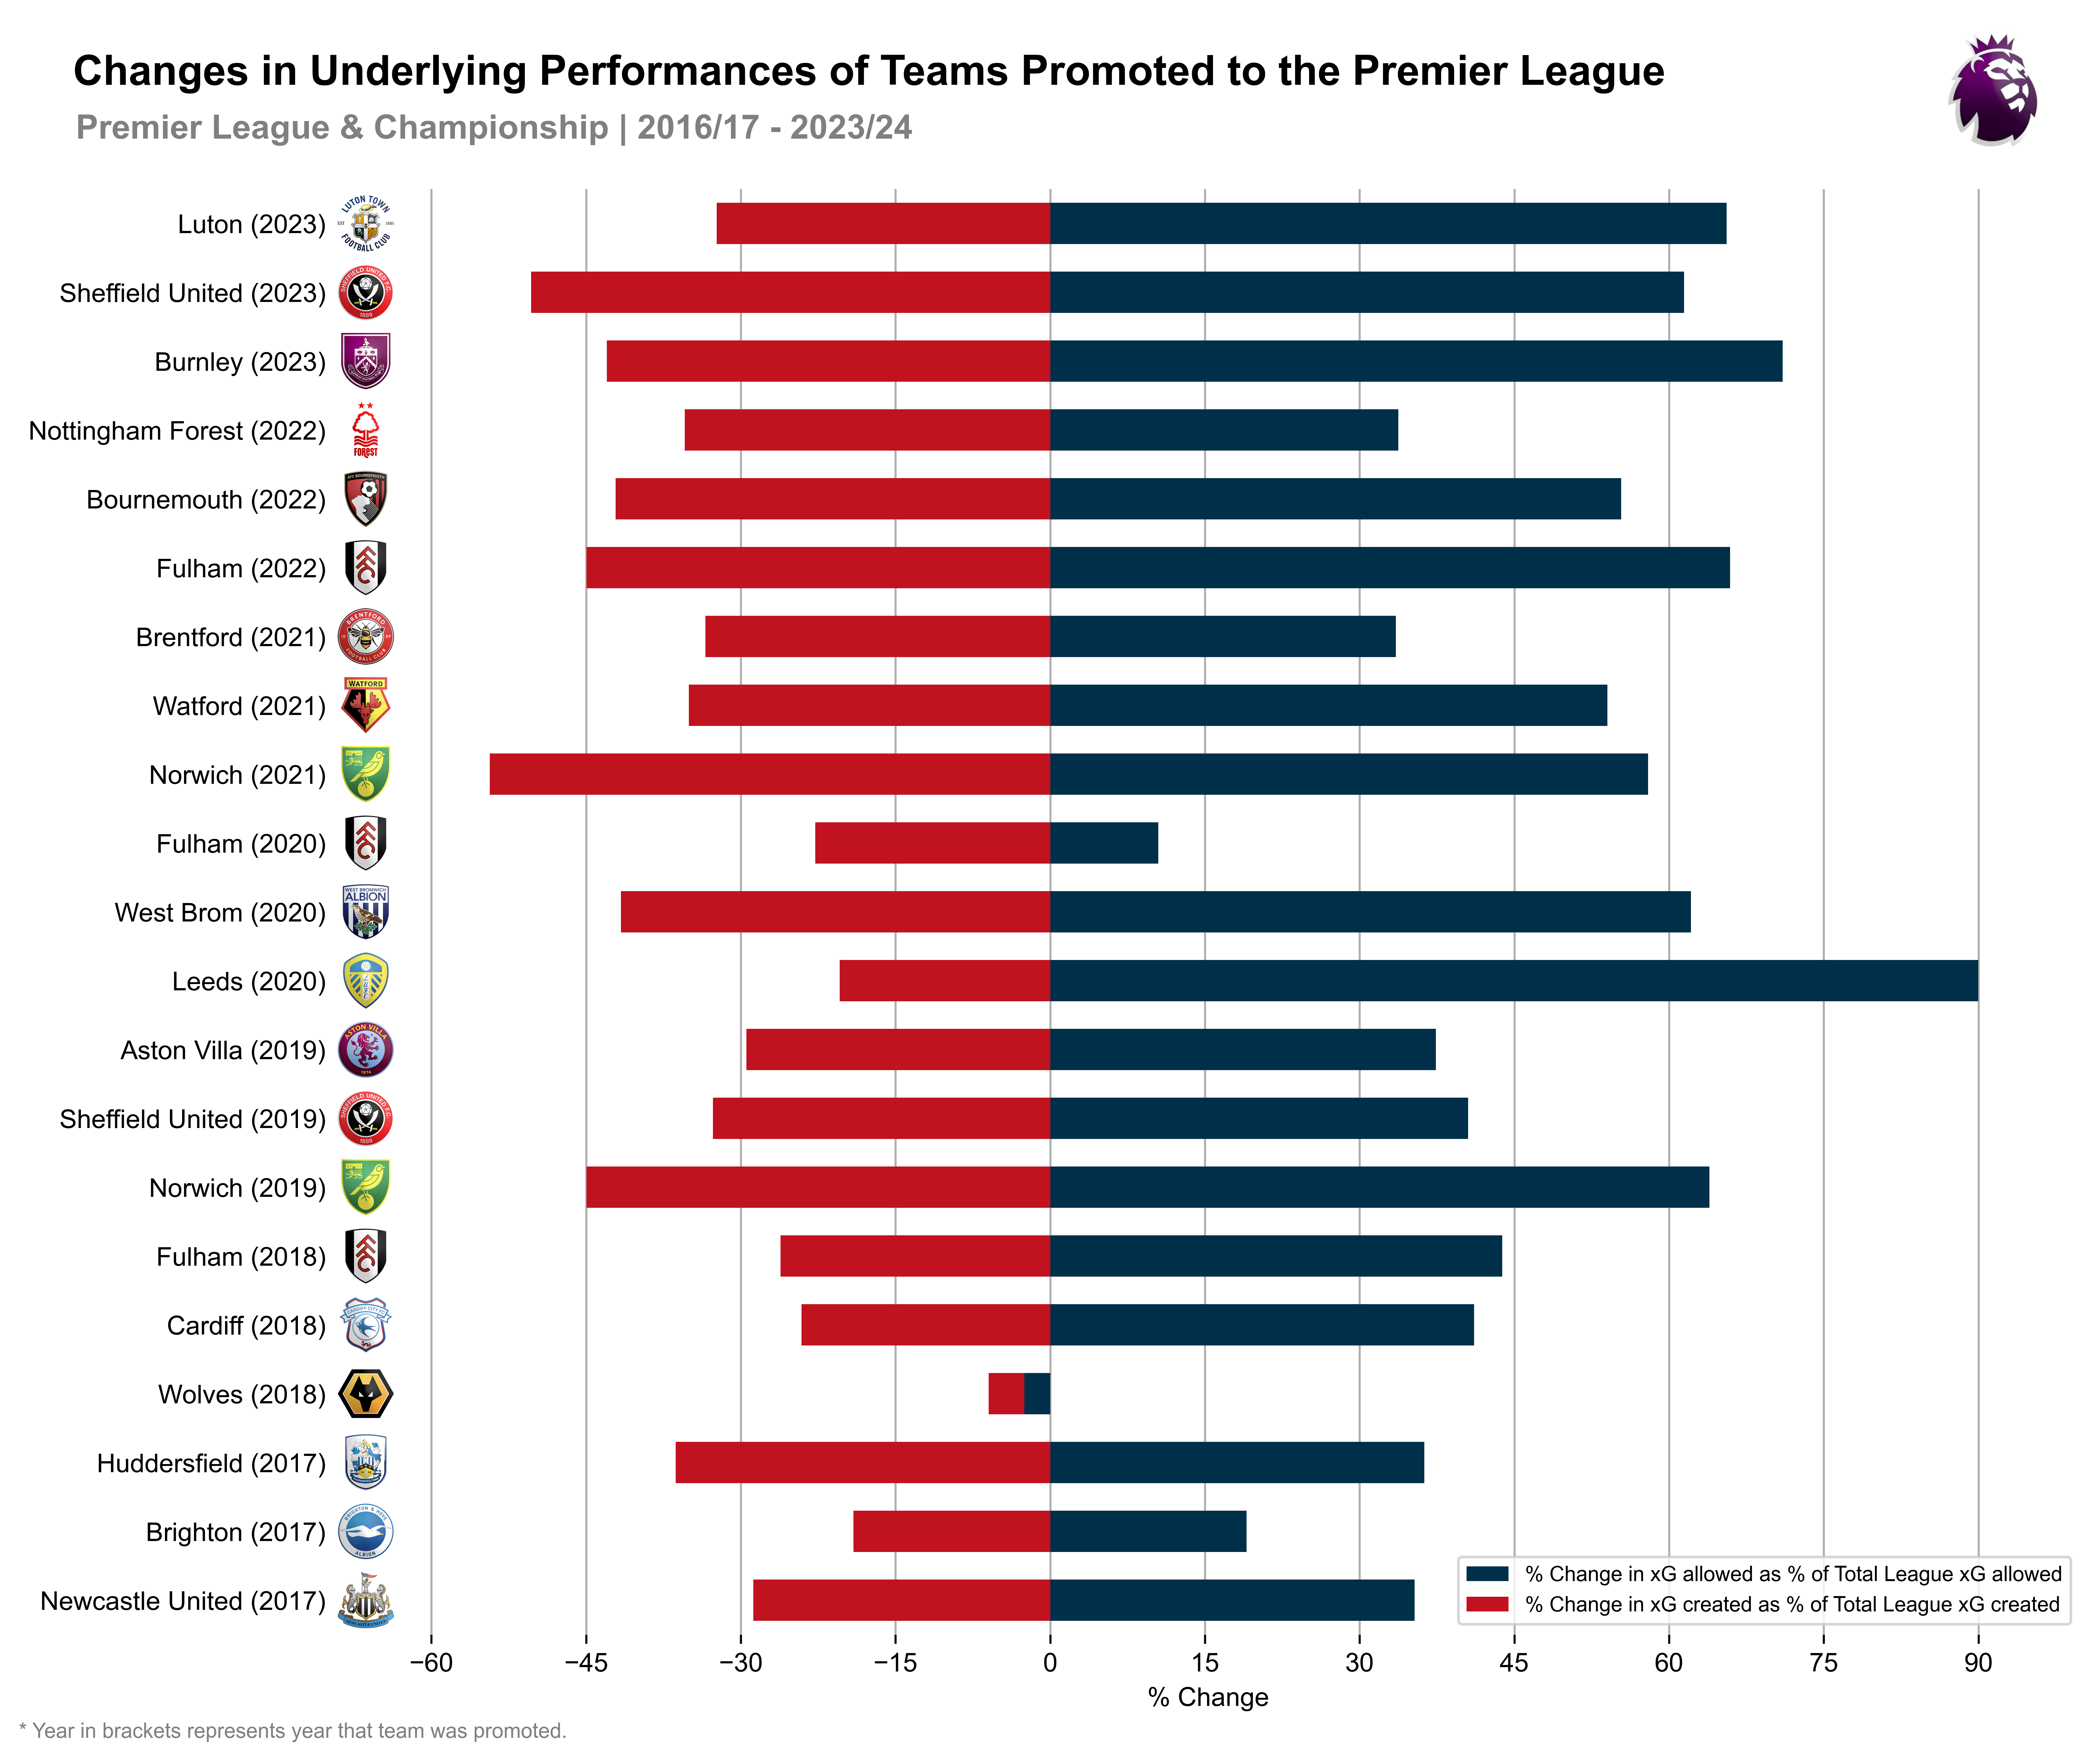
Once again, Wolves are the massive outliers here. Their attack was hardly impacted and they actually managed to improve their defensive performance, which is difficult to make sense of at first impression. As noted before, the team had money pouring into it at this point. But, another theory is that Nuno’s pragmatic, defensive Portuguese style may be better suited to an underdog role, often utilizing a mid-to-low block and striking in transition.
Leeds are outliers for the opposite reason—their xGA increased by around 90%. My theory here is the opposite of Wolves'. Bielsa's aggressive man-marking style, effective with a talent advantage in the Championship, struggled with a talent disadvantage in the Premier League. Despite their strong overall performance and 9th place finish, their defence was vulnerable, as shown in games like those against Manchester United, where the intense man-marking was easily exploited.
Assessing the performance of promoted teams in the Premier League based on their Championship campaigns is a complex but important task for creating accurate predictive models. While ignoring Championship data or applying a simplistic penalty presents challenges, this study highlights that comparing underlying metrics such as expected goals (xG) and expected goals against (xGA) offers a more nuanced approach. By analysing the normalized changes in performance between the two leagues, we can estimate a performance drop-off more accurately.
Although the sample size is limited, this study provides valuable insights. Promoted teams, on average, see a significant decrease in xG and an increase in xGA, despite an outlier like Wolves which could highlight the importance of tactical style in adjusting to the Premier League.
Moving forward, the TEAM model will continue to evolve as more data becomes available, refining the estimates and enhancing predictive accuracy in assessing promoted teams' Premier League prospects.